November 18, 2014 •Brian Wong

 Once we selected the teams for the playoffs, we took a look at how the actual games would be decided. First, we examined what factors determine whether a team wins or loses. Then, using these factors, we built a probabilistic model based on composite ratings (see below) for the current season’s worth of games. This model relates team attributes to their chance of winning. We used this model to determine how the teams in our simulated playoffs would fare.
Fortunately, as advanced analytics have permeated the sports world, some smart people have developed very useful statistics for predicting the outcome of individual college football games. For our analysis, we considered using three different measures, the Fremeau Efficiency Index (FEI) rating, the S&P+ rating, or the F/+ rating.
FEI is a composite of possession-based measures. FEI measures a team’s scoring rate per possession and assigns an efficiency rating based on their scoring success rate. This measure corrects for opponent quality.
S&P+ measures the success rates of individual plays based on yardage, and combines that success measure with a points-per-play measure, which adjusts for a team’s propensity to score (or allow scores) on quick, explosive plays. S&P also adjusts for other measures, such as opponent quality.
F/+ is a composite measure of FEI and S&P+, with a number of adjustments to both measures. We used F/+ for our analysis, because it considers the widest range of dynamics in a team’s overall ranking. By aggregating both possession and drive-based data, F/+ captures an immense amount of data in a single statistic, which is useful for our win probability model.
To determine our winners, we boiled down a football game into two components: how good a team is (its F/+ rating) and the consistency of the team (the variance in a team’s performance over the season), which we defined through the development of a “Consistency Score.” The “Consistency Score” attempts to proxy how consistently a team performs over the season. The 2013 Florida State Seminoles are a great example of an incredibly consistent team. They bludgeoned their opponents week in and week out on their way to an undefeated season, and a BCS national championship game victory. On the other hand, the 2012 Notre Dame Fighting Irish were wildly inconsistent. While they ended the regular season undefeated, their performances ranged from dominant to downright shoddy, particularly on the offensive side of the ball.
One might be tempted to measure consistency through the variance of a team’s F/+ rating over the course of a season. However, that won’t work since this statistic is calculated from the composite data from the entire season each week. This means that any changes in F/+ rating are not only based on team performance, but also the existence of more data so that one can more accurately determine how good each of a team’s opponents were later on in the season. So the variance in the F/+ rating just measures the variance in a team’s opponents, not the internal variance of the team’s ability to win. So we need to develop our own consistency score.
To develop the Consistency Score, we first modeled the win probability of each team through a logistic regression that relates yards gained, yards allowed, and turnovers to win probability:
Logit(Prob. Winning) = .010252*opponent-adjusted yards gained - .006391*opponent-adjusted yards allowed + .767746*turnover margin
We then used this model to find the standard error of a team’s predicted probability of winning. After that, we multiplied the playoff team’s year-end F/+ rating and the ratio of the standard error (consistency value) for performance to overall performance (which was just the probability of winning using the bowl game statistics in the regression above) to develop a proxy for the standard deviation of a team’s F/+ rating, which is simply:
SD(F/+ Rating) = Year-end F+/ rating * (SE of predicted year-end performance/predicted year-end performance)
This was defined to be the “Consistency Score.” After we obtained a particular team’s F/+ rating and the Consistency Score (standard deviation) of its F/+ rating, we developed a probability distribution of F/+ ratings for each team. We set the average of the distribution to the team’s F/+ rating, and its standard deviation to the team’s consistency score. We randomly drew from this distribution 1000 times to determine a team’s “consistency-adjusted” F/+ score, taking into account the team’s consistency.
To compete two teams, we developed a win probability for each competing team by taking the ratio of each individual team’s consistency-adjusted F/+ score, divided by the sum of the consistency-adjusted F/+ scores for both teams in the game. Finally, we drew a random number from the uniform distribution between zero and one, and if that number was less than or equal to the win probability for the favored team in the matchup, that team would “win” the game, and move on to the next round. This process was repeated until a champion was crowned.
A quick example:

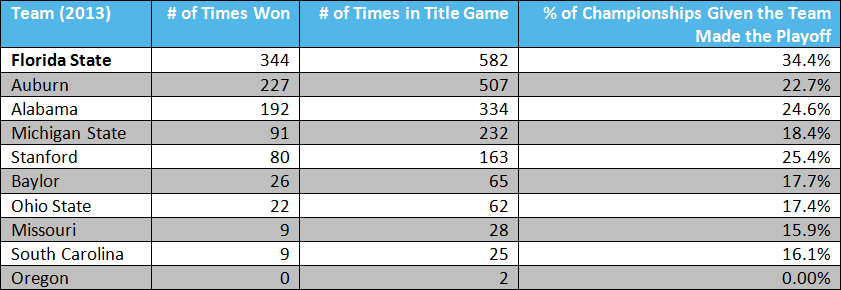
The last post in the series will show our dramatic results! As a teaser, the table below summarizes our simulation of last year’s “playoff,” and summarizes the outcomes of 1000 of our simulations for the 2013 season. However, in our next post, we will look at the outcomes for every year, back to 2005, over the course of 1000 simulations, AND we will take a closer look at our one randomly selected bracket from each year, as determined in our previous post.
This post was written with the help of Matt Duffy and Amy Deora.