
November 11, 2015 •Shane Thompson
In an earlier post, Summit’s Program Evaluation Team argued why program evaluation is important to Federal Departments and Agencies. As discretionary budgets continue to tighten and departments and agencies are required to justify their programs and budgets, program evaluation can provide the evidence needed to make informed decisions about continuing, improving, or expanding programs.[1]
As shown in Figure 1, impact evaluations are distinct among other forms of program evaluation. They can provide empirical evidence of the causal effects of programs or policies on important outcomes. For this reason, Federal Agencies often prefer impact analyses when evaluating mature programs. In this post, we describe four methodological techniques Summit uses to estimate program impacts from administrative data blended with observational and program data.

Figure 1. Generic program logic model by evaluation type.
Impact evaluations require a treatment group (i.e. those who are participating in a program or policy) and a control group (i.e. those who are identical to the treatment group, minus participation in the program or policy). Control groups provide the counterfactual of program participants: an estimate of what would have happened to program participants in the absence of the program. Program evaluators use sophisticated techniques to identify data-driven, statistically-matched control groups.
Four methods for identifying control groups and estimating program impacts include: (a) difference-in-difference, (b) regression discontinuity designs, (c) propensity score matching, and (d) synthetic controls. We explain how each method identifies control groups, when each is used, and provide a graphical depiction of the method. Click here for our page on program evaluation methods.
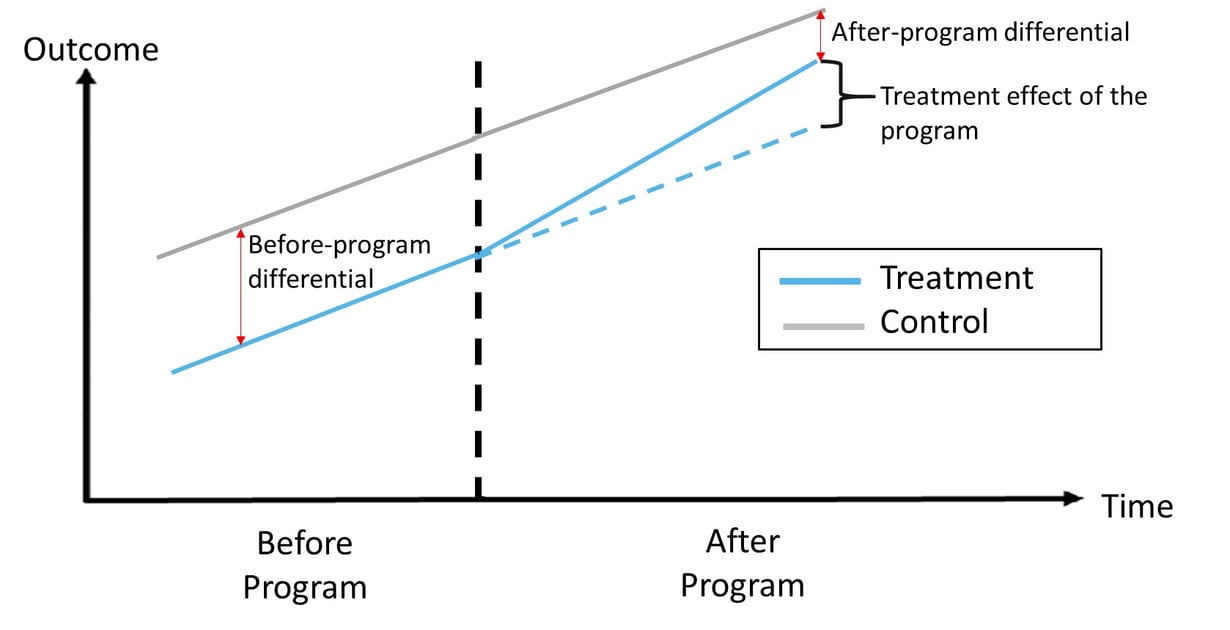
 How does DD identify a control group?
The outcome trend in the pre-treatment period is estimated for program participants and the control group.
The control group must have an outcome trend that is NOT statistically significantly different from program participants (i.e. a parallel outcome trend in the pre-program period).
When can I use DD?
When there are many program participants and control groups
When there are many years of pre-program data (three or more) for program participants and control groups
When program participation is NOT a function of unobservable characteristics
 How does RDD identify a control group?
A forcing variable assigns participants to the program.
Program participants just above and just below the threshold of the forcing variable are the treatment and control groups, respectively.
When can I use RDD?
When there are many program participants and non-participants in a small interval around the threshold of the forcing variable.
When potential participants cannot manipulate their position around the threshold.
 How does PSM identify a control group?
The probability of being a program participant is estimated for participants and non-participants.
Program participants and non-participants are matched by their probability to be in the program.
When can I use PSM?
When there are many program participants and non-participants in a small interval around the threshold of the forcing variable.
When potential participants cannot manipulate their position around the threshold.
 How does SCM identify a control group?
A donor pool of potential control groups is identified.
A weighted combination of that donor pool is constructed to be approximately equal to the treatment group in pre-treatment outcomes AND observable characteristics.
When can I use SCM?
When there are few treatment units and many potential control units.
When there are many years of pre-treatment data (three or more).
When stand-alone control groups are poor matches for treated groups.
Next week, the Summit Program Evaluation Team will discuss our net impact analysis flowchart, which summarizes the most important components of any net impact evaluation. We will also identify possible deliverables and their sequencing as well as the most important kinds of data that need to be gathered and their sequencing. We’ll also discuss how each deliverable in the sequence constrains subsequent deliverables and makes the cumulative net impact analysis more credible than it would be otherwise.

Reference
U.S. Executive Office. “Economic Report of the President.” Washington, DC: U.S. Government Printing Office, 2014.
[1] See Box 7-1: Impact Evaluations, Process Evaluations, and Performance Measurement of U.S. Executive Office, “Economic Report of the President,” (Washington, DC: U.S. Government Printing Office, 2014).